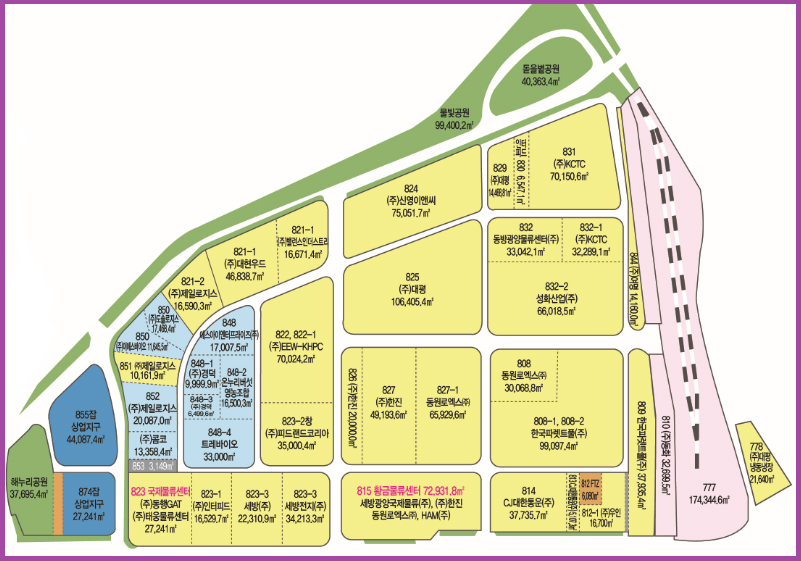


East hinterland utilization plan
| Facility | Area(㎡) | Composition ratio(%) | Remark | |
|---|---|---|---|---|
| Total | 1,943,810 | 100.0 | ||
| Class 1 port hinterland | 1. Multi-modal logistics & manufacturing facilities | 1,216,496 | 62.6 | |
| 2. Public facilities | 656,022 | 33.7 | ||
| - Road | 336,473 | 17.3 | ||
| - Green zone | 292,373 | 15.0 | ||
| - Other public facilities | 27,176 | 1.4 | ||
| Class 2 port hinterland | 71,292 | 3.7 | ||
※ Click below image to see a larger image.